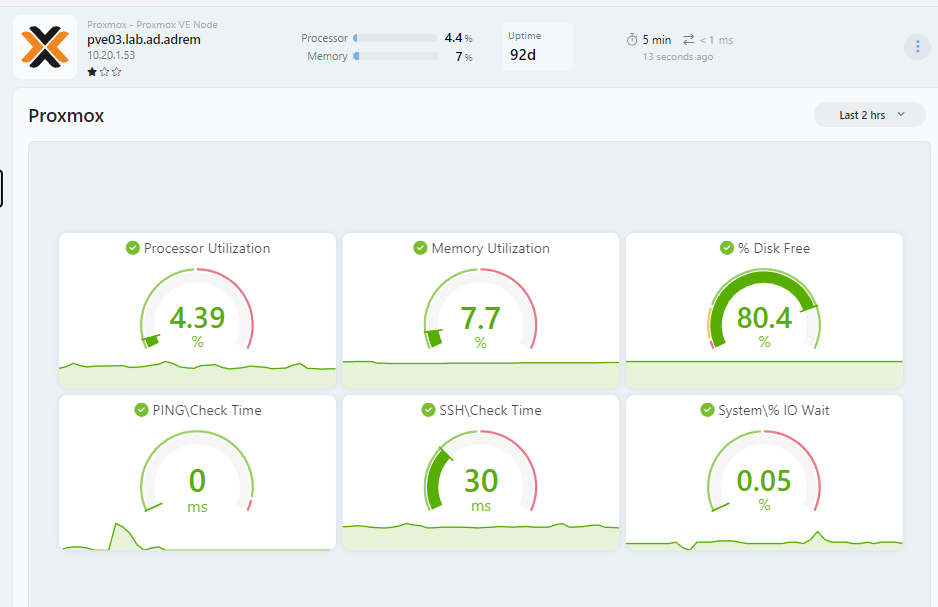
NetCrunch 16 adds Proxmox VE monitoring at the same level as other supported virtualization platforms.
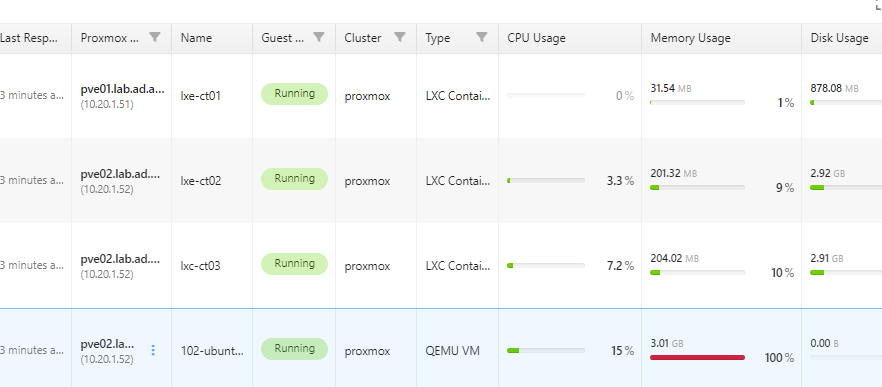
You can monitor Proxmox hosts, virtual machines, containers, storage, and cluster health from one place.
NetCrunch detects Proxmox VE clusters automatically, discovers their resources, and presents them in a structured view so you can quickly check host load, VM status, and overall virtualization health.
The Windows DHCP Sensor monitors DHCP server health and scope usage, including available IP addresses and percentage of addresses used.
By default, it can alert when a scope is close to exhaustion or when a lease is marked as Declined, which may indicate an IP address conflict.
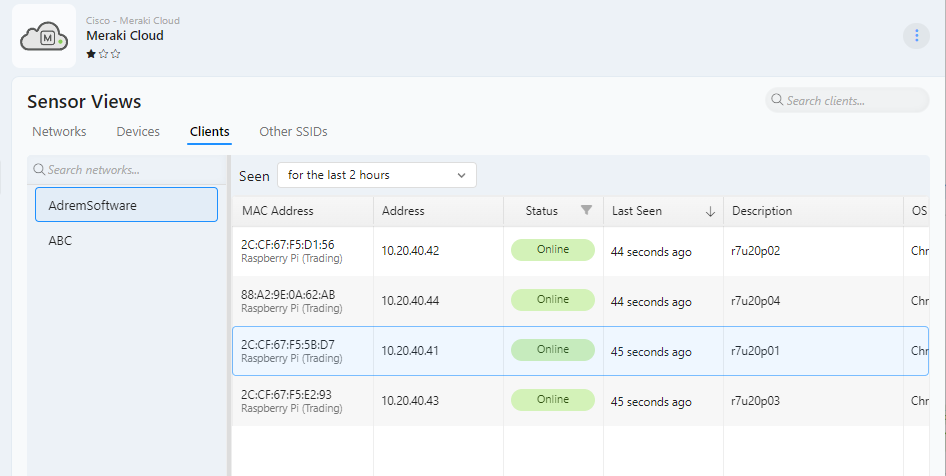
Meraki Cloud monitoring provides a centralized view of devices and networks in a Meraki organization. One sensor covers the whole organization, with networks and devices discovered automatically and shown as counter instances.
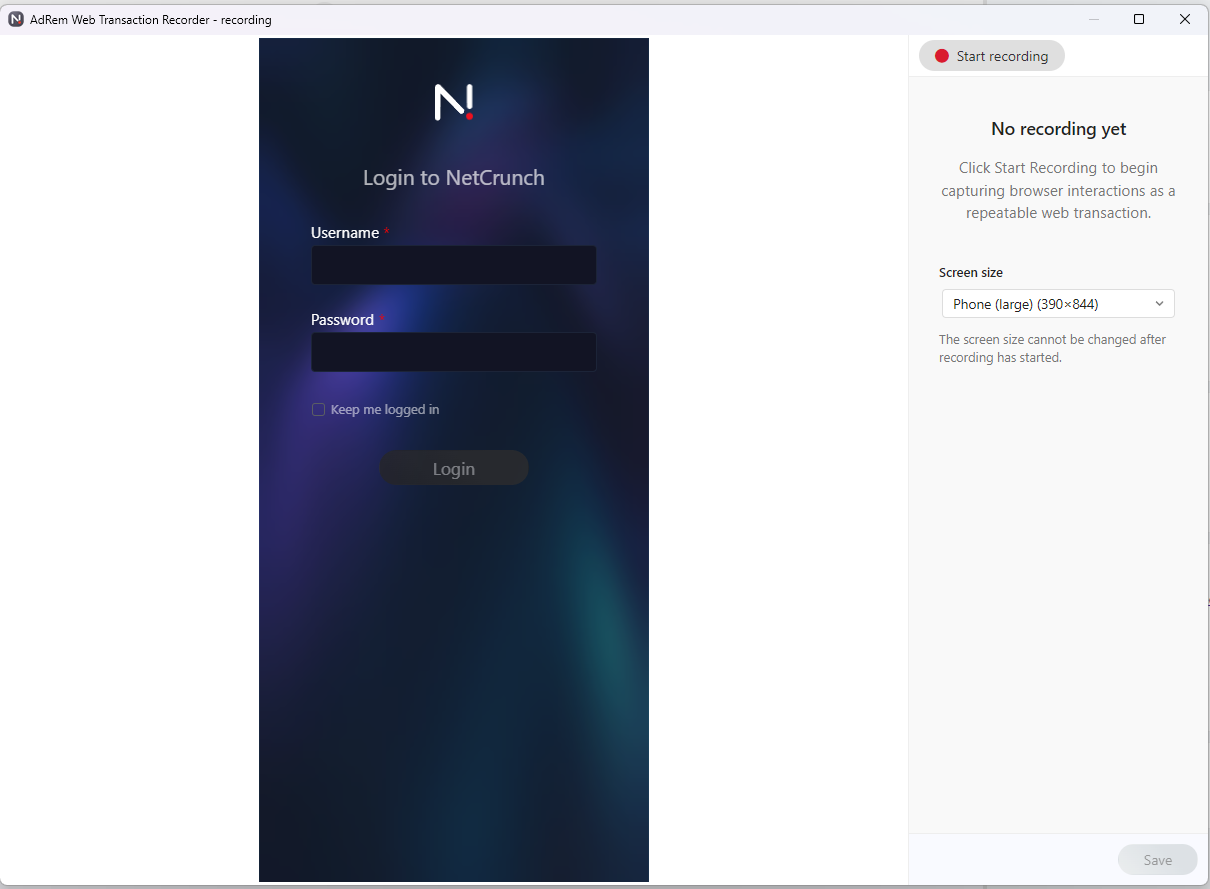
The Web Transaction Monitor checks whether a website or web application works as expected by replaying real browser actions.
You can record a user flow, such as logging in, opening a page, submitting a form, or checking a result, and then run it regularly as a monitoring check. This helps detect problems that a simple HTTP check cannot see.
Transactions can verify that expected text or images appear on the page. They also support modern web applications that use Shadow DOM, and can simulate mobile page layouts to check how the site behaves on smaller screens.
NetCrunch 16 moves the event database to PostgreSQL 18.x, providing a faster, more scalable, and more reliable foundation for event and alert history.
Migration from the previous event database runs automatically in the background after the upgrade. During this process, older event data may be temporarily unavailable, while new events continue to be processed.
The new database uses a simplified, partitioned schema designed for better performance with large event volumes. In typical workloads, it can perform up to 10 times faster than the previous event database.
Because the data is stored in PostgreSQL, it can also be accessed through the standard PostgreSQL API for reporting, integration, or external analysis.
NetCrunch 16 introduces a new PostgreSQL-based Flow Server with faster processing, longer retention, and support for distributed deployments.
Flow servers can now be installed in multiple network locations and connected through NetCrunch probes. This allows flow data to be collected closer to the source while keeping the NetCrunch server and console centralized — including cloud-hosted deployments.
The new Flow Server stores flow data for 24 hours by default, giving users more time to analyze traffic spikes, unusual communication, and application usage. Additional, Flow Server Pro licence removes the limit entirely.
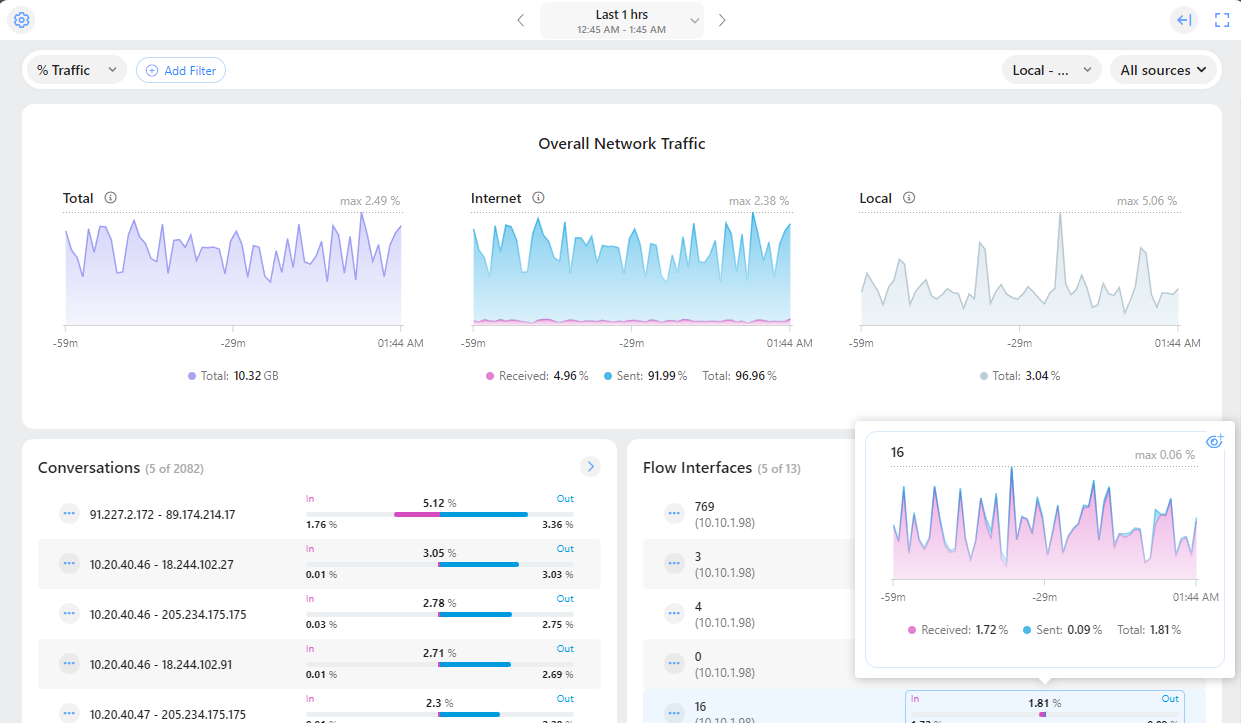
NetCrunch 16 also adds a redesigned Flow Analyzer with improved sFlow analysis, country classification using IP2Location, extended time ranges, and support for querying multiple flow servers.
Until now, NetCrunch mainly processed statuses and metrics. NetCrunch 16 adds a new category: Data Objects, designed for richer structured data from external sources.
Data Objects can be returned by data parser scripts together with statuses and metrics. The source data can come from a file, query, script output, sensor response, or telemetry stream, or other external input.
A Data Object can represent:
NetCrunch selects the visualization automatically based on the declared object type.
Data Objects appear in Sensor Views in the Node Status window, so custom sensors and external integrations can expose structured results directly in the node context.
This mode is recommended for local environments where probes maintain a stable connection to the NetCrunch Server. NetCrunch can automatically distribute monitoring across available probes and move nodes to another probe if one goes down.
Offline Probe mode is designed for remote probes that may temporarily lose connection to the server.
The probe continues monitoring locally and replicates data after the connection is restored. NetCrunch also handles alerts carefully to reduce false notifications.
Probes can now update automatically to match the NetCrunch Server version. Updates can be downloaded from the Internet or delivered from the server, which is useful for isolated or air-gapped environments.
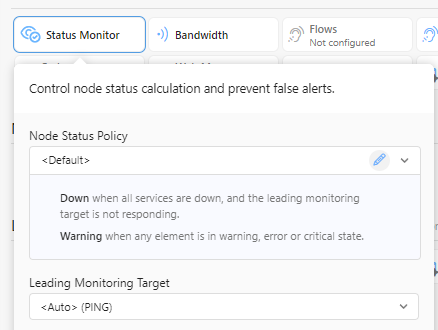
Node Status Policy lets you define when a node should change to Warning or Down. You can choose the leading monitoring target from services, sensors, monitoring packs, or other monitored objects.
The default NetCrunch policy marks a node as down when all network services stop responding.
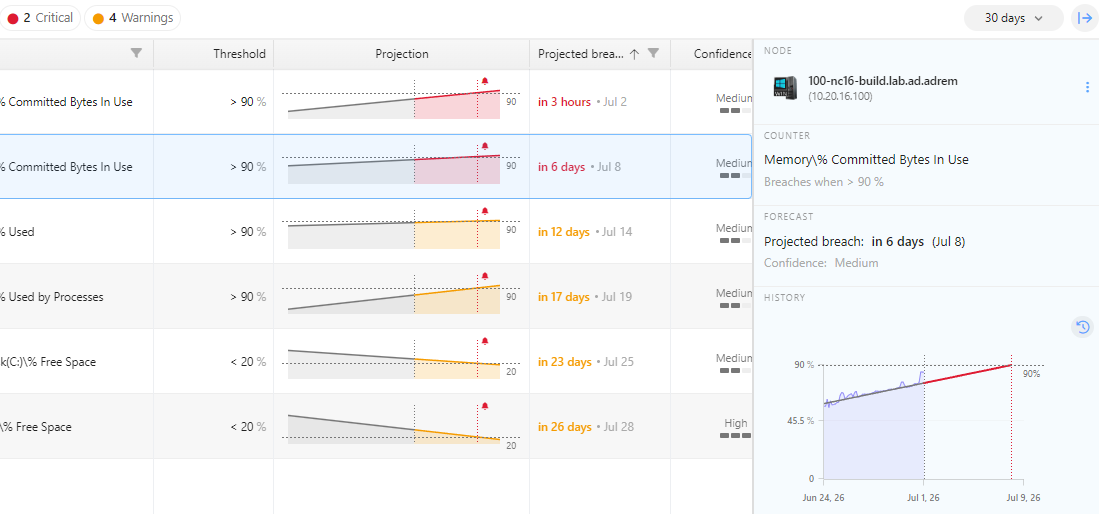
NetCrunch 16 adds a Predictive threshold type that can trigger an alert when a monitored value is expected to cross a threshold within a defined number of days.
Predictions are calculated once per day and require several days of data to produce meaningful results.
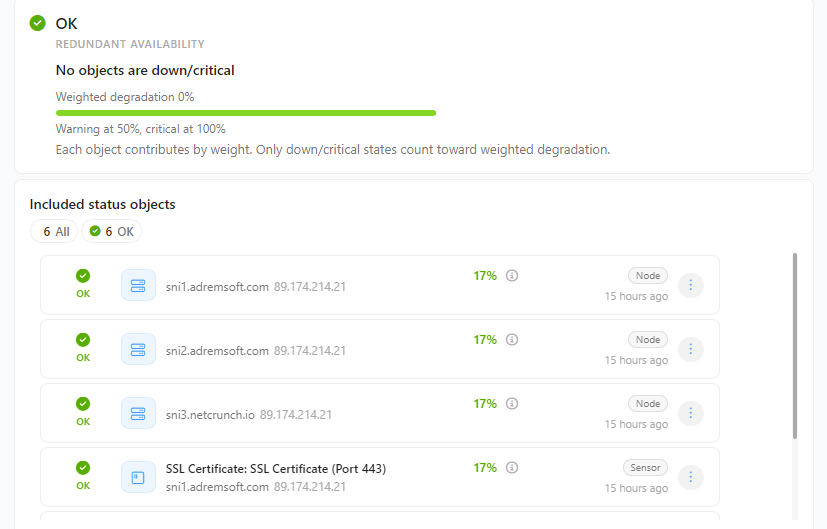
Composite Status has been extended with a simpler UI, support for 10 object types, and new threshold and importance settings for redundancy mode. Node Status also gets a dedicated page for viewing object statuses.
NetCrunch 16 adds two important alert integrations: ServiceNow and Rootly AI.
The new ServiceNow integration provides one-way alert delivery from NetCrunch to ServiceNow. It is designed for organizations that use ServiceNow as their established ITSM platform and need NetCrunch alerts to enter existing incident, ticketing, and service management workflows.
NetCrunch 16 also adds a two-way Rootly AI integration for modern incident response teams. NetCrunch can open alerts in Rootly AI, while alert resolution can be synchronized back from Rootly AI to NetCrunch.
This allows incidents to be managed externally without leaving related alerts open in NetCrunch after they have already been handled.
The new NetFlow Server uses PostgreSQL many times faster than a previous version, and increases default retention to 24 hours.
It can run in remote sites, connect through probes, and support multiple flow servers.
With a Flow Server Pro license, retention is limited only by available disk space.
The Flow Analyzer has been redesigned from scratch. It supports multiple filters and exclusions, a sidebar for exploring grouped elements, and 15 analysis dimensions, including top conversation pairs, top interfaces, and country-based traffic.
Flow servers can now be deployed across multiple network sites, allowing flow data to be collected and analyzed closer to the source.
Each flow server is connected through a NetCrunch probe, so remote sites can monitor traffic locally while the NetCrunch server and console remain centralized — including cloud-hosted deployments.
When flow data is needed, the console automatically connects through the appropriate probe and queries the selected flow server directly.
NetCrunch 16 adds Master Password protection and FIPS compatibility mode.
The Master Password protects encryption keys used for encrypted data stored on disk and is also required for protected backups. If the Master Password is lost, protected backups cannot be restored.
The new Credentials Manager shows credential assignments in one place, including custom profile assignments.
It also detects credential-related errors, making it easier to find and fix incorrect monitoring settings.
NetCrunch 16 can store additional counter metadata, including unit conversions, value mappings, and default thresholds.
This metadata can be shared across widgets, trend views, and other places where counter data is displayed, making values more consistent and easier to read.
NetCrunch can now be used with AI tools through an MCP Server. It exposes the same capabilities available through the REST API, providing about 50 tools for automation, and integration scenarios.
NetCrunch 16 adds multi-factor authentication for the Desktop Console, helping protect administrative access even when a password is compromised.
Graphical View dashboards can now synchronize widget time ranges across the whole dashboard. When the time range changes, all compatible charts and historical widgets use the same period, making related metrics easier to compare.
With node synchronization enabled, all compatible widgets refer to one selected node. This allows one dashboard template to work for many similar objects, such as servers, devices, applications, or sensors.
Node-synchronized dashboards can also appear in the Node Status window for nodes matching the dashboard group.
Users can open a node and see a focused dashboard already scoped to that node type.
NetCrunch can use a static map region as a full panel background or display it through a Static Map widget. Map regions can be selected from supported map providers and used as a geographic canvas for dashboards, maps, and other graphical views.
You can use the built-in limited map access included with an active NetCrunch subscription, or provide your own API key for Google Maps or MapTiler. This allows organizations to choose between simple built-in access and provider-managed usage for larger deployments or more customized map styles.
When a map background is selected, widgets can be positioned using geographic coordinates. This makes it possible to place nodes, sites, links, and status indicators directly on the map according to their real-world location.

Text and shape widgets can now display formatted content, including bold text, italic text, and lists.
The Static Map widget adds a selected map region using Google Maps or MapTiler. Both providers support different map styles and light or dark mode.
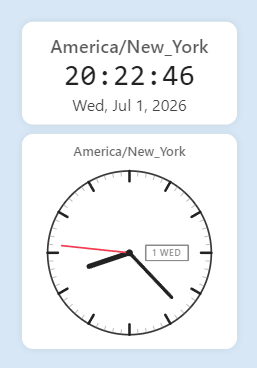
The Clock widget can show date and time in analog or digital mode. It supports multiple time zones, making it useful for dashboards covering several locations.
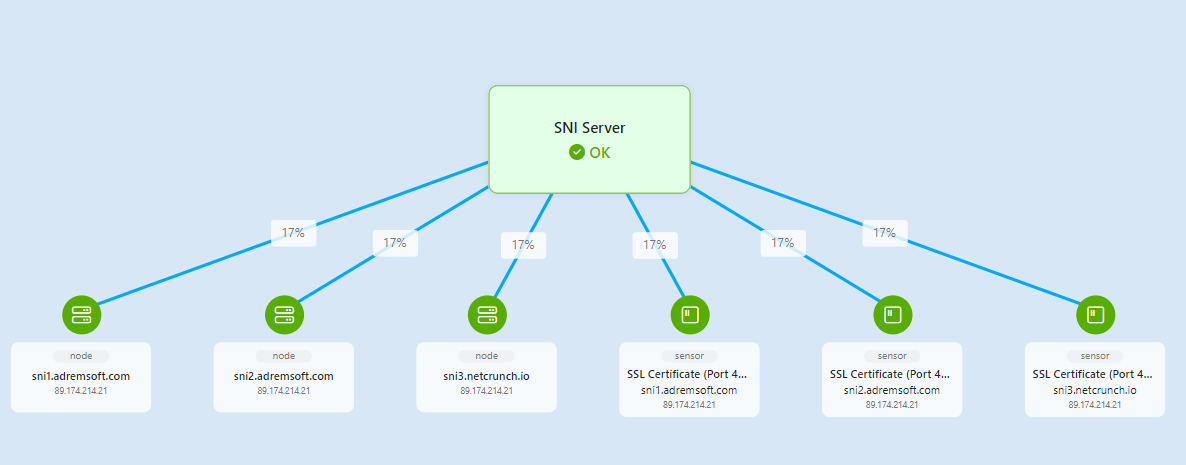
Business Service View creates a live graphical representation of service dependencies built from nested composite status nodes.
The diagram updates automatically when dependencies change and uses automatic layout similar to physical segments and routing maps.
The new Predictive Threshold can forecast values such as disk or memory usage. Common counters can include predefined predictive thresholds, and the Forecasting tab shows predicted days to threshold and prediction quality.
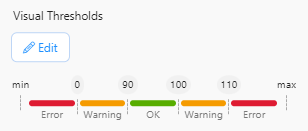
Visual thresholds now support five segments in addition to the previous three-segment model. This allows more flexible ranges, such as keeping the normal green range in the middle.
NetCrunch 16 replaces many third-party UI libraries with optimized in-house components.
The new UI is faster, uses less memory, and enables NetCrunch-specific features such as sticky groups and advanced grid filtering.
This is especially important when displaying many charts, large tables, and real-time status views.
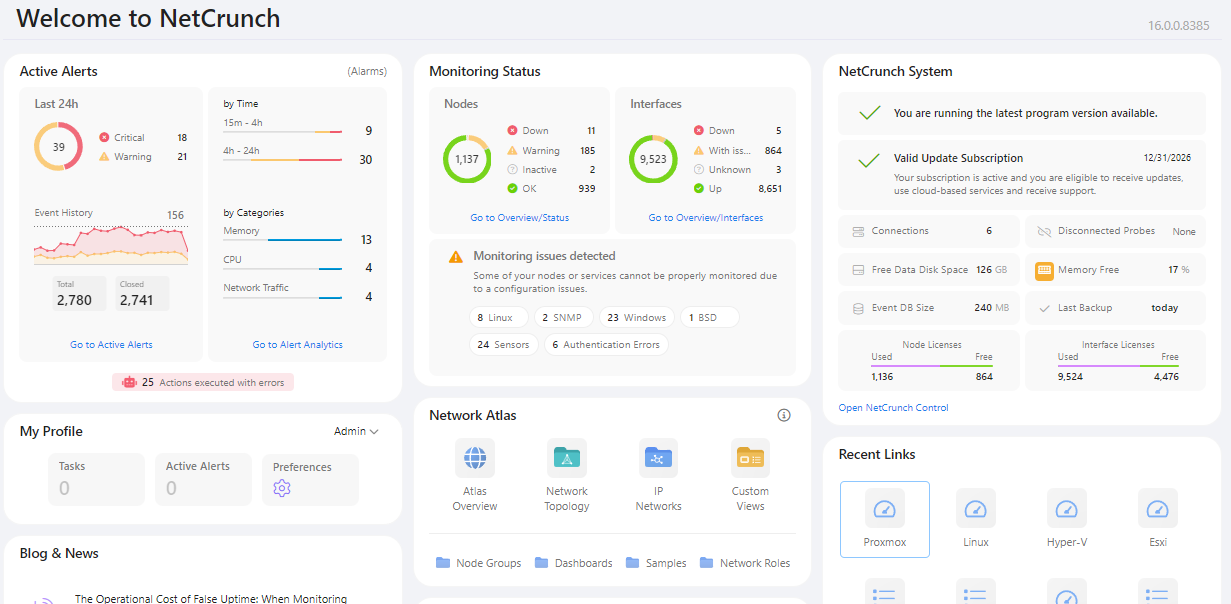
The new Home screen gives a clearer overview of alerts, monitoring status, system state, licensing, and other important areas. Each item is clickable and opens the relevant filtered view.
New grids improve grouping, filtering, and multi-selection. Group headers can stay visible while scrolling, and groups are partially expanded by default to make long lists easier to browse.
Filters now handle complex columns, such as sensors filtered by type and state. Filter lists also act as quick statistics by showing item counts.
Multi-selection is cleaner and works better on touch devices, using checkboxes and an action dropdown above the grid.
The NetCrunch 16 web console now works in mobile mode. Most web console features are available on the phone, including maps, dashboards, panning and zooming, and mobile-friendly tables with filtering and sorting.
The mobile console connects through NetCrunch Connection Cloud, a secure HTTPS relay service. You can open it quickly using the QR code available in the Help panel.
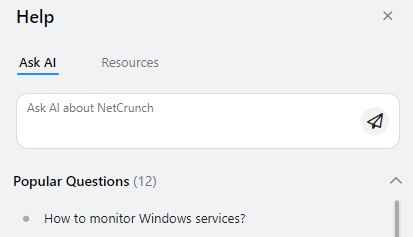
The new Help panel provides quick access to documentation, blog posts, mobile console access, and other NetCrunch resources.
The Ask AI tab lets you ask questions about NetCrunch directly from the console. Answers are generated from available NetCrunch sources, including documentation, blog articles, and the knowledge base.
Responses include links to the source materials, so you can quickly open the related documentation or article for more detail.
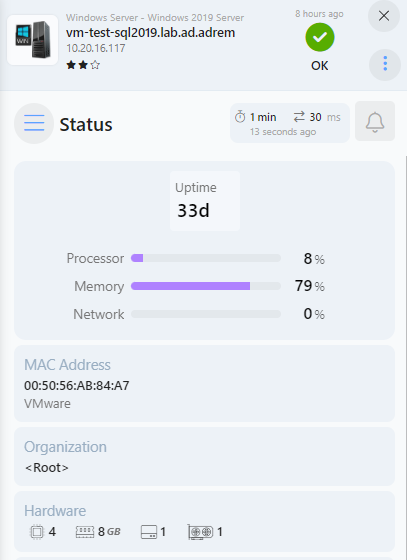
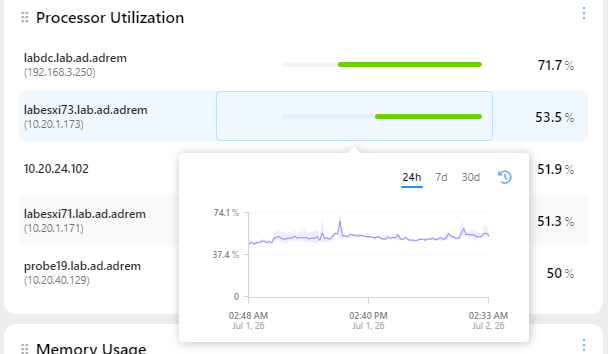
Percentage bars in Windows views and Top Charts now show an automatic tooltip on hover.
The tooltip displays the exact value behind the bar, making compact percentage indicators easier to read without expanding the view or opening a separate chart. This is especially useful in dense lists where bars are used to compare CPU load, memory usage, disk space, interface utilization, or other percentage-based metrics.
The Task view has been improved with Object References and new filters such as Overdue Tasks and My Tasks. This makes it easier to connect work items with monitored objects and operational context.
Interfaces can now be grouped by VLANs as well as switches, including Switch > VLAN and VLAN > Switch layouts.
An ungrouped view also allows global sorting across all devices.
The traffic chart adds live mode, so you can observe traffic on a selected interface in real time.